INTRODUCTION
According to Redding (1996), the theory of the low skill trap is an endogenous growth model where investments in human capital or education and research and development (R&D) are strategic complements: the economy may be trapped in the low skill equilibrium where workers are poorly trained, and firms do not invest in R&D and produce low quality products. The deficiency in education may be related to the firm’s investment in product quality, which takes the form of R&D [1].
There are two types of equilibria: high and low skill. In the low skill equilibrium, also called ‘the low skill trap’, firms find it unprofitable to invest in R&D since workers do not acquire education and therefore the expected return to R&D is low. In addition, workers expect firms not to invest in R&D, which reduces the expected wage and their investment in education and human capital. In the high skill equilibrium, workers expect the firms to invest in R&D, which increases the expected wage and therefore increases their incentive to invest in human capital. In turn, a high expected stock of human capital raises the firms’ return to invest in R&D and thus increases the incentives of the entrepreneur to invest in R&D.
In theory, there are strategic complementarities and interdependence between investments in R&D and investments in human capital, which jointly determine the ‘high’ and ‘low’ skill equilibria. The low skill equilibrium is characterized by low rates of human capital accumulation and low R&D, whereas the high skill equilibrium is characterized by both high rates of R&D and human capital accumulation.
This paper investigates the theoretical model of Stephen Redding to a country wide approach applied to 28 OECD countries. We looked at the year 2021, with R&D expressed in PPP dollars current prices and human capital in percent of adult population with at least a bachelor’s degree. R&D investments source of funds are from business enterprises, rest of the world, government, higher education and non-profit sector.
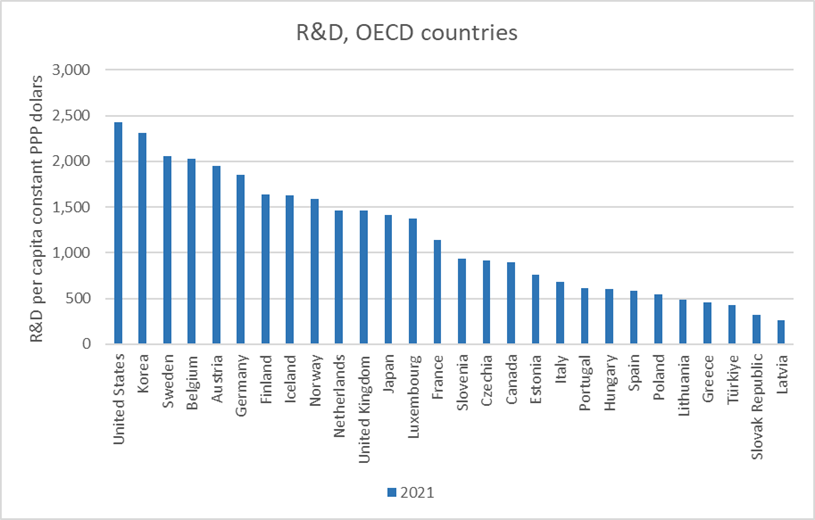
We conclude that, empirically, the theory is supported by the OECD data and this paper finds evidence of Stephen Redding’s skill equilibrium hypothesis at the country level. U.S., Sweden and Korea are in the top 90th percentile of R&D and human capital, exhibiting R&D higher than $2,034 per capita and human capital higher than 50.7%. Turkey, Slovakia and Latvia are in the bottom 10th percentiles exhibiting below $450 R&D per capita and 27.4% human capital. All OECD countries can be grouped belonging in either the high or low skill trap.
LITERATURE REVIEW
There is little research into the potential complementarities between human capital investment by workers and R&D investments. It is necessary to be able to demonstrate these potential virtuous circles in order to design policy recommendations regarding government support incentives for education and technology innovations.
The implementation of new knowledge is possible by a highly qualified labor force, according to Nelson and Phelps (1966) [2]. The importance of human capital e.g., education, skills, knowledge of workers is documented by Lucas (1988) and is shown to contribute to increased productivity and the capital stock. Education is found to decrease crime rates, yielding to social benefits [3].
R&D performed by a company is crucial for its long-term growth and output and together with human capital have been found to contribute to the economic growth and productivity of a nation according to articles written by Lucas (1988) and Romer (1990) [3, 4].
The term low skill equilibrium was first introduced by David Finegold and David Soskice (1988) who argued that Britain was trapped in a low skill equilibrium “in which the majority of enterprises staffed by poorly trained managers and workers produce low quality goods and services” [5]. Finegold and Soskice analyzed Britain education and training system which failed to provide with high skill labor force, which in turn contributed to Britain’s poor economy. The analysis focuses on historical reasons and institutional constraints, which prevented Britain from reforming its educational and training system.
A low-skill economy is characterized by a limited number of high-skill jobs across various sector, a workforce with below-average levels of education and training, low labor productivity, and consequently, low wages. According to Finegold and Soskice (1988) and Cooke and Kulandaisamy (2010), the high-skill equilibrium is defined by firms that produce high-quality, specialized goods and services, supported by a highly qualified workforce capable of quickly adapting to changes in work process and continuously driving product innovation [5, 6].
Finegold (1993) investigates the reasons of Britain low demand of skilled labor force where the firms are led by poorly trained managers, and the workers produce low-quality goods and services. The low skill equilibrium is analyzed within a framework of investment in higher-level skills and institutional factors that can create incentives or disincentives for the investors in the skills (individual, the government, and managers). The institutional components analyzed are financial markets, relations between firms, employers’ organizations, management education and training. [7]
Wilson and Hogarth (2003) valued the evidence of the low skills equilibrium in particular parts of the UK with focus on the individual organizations and their product strategy. Their approach was to use firm level case studies in the food processing and business hotels sectors in East and West Midlands, UK. To investigate the low skill equilibrium trap, the issues addressed were the success of the product in addressing external competitive pressure, capturing and securing the existing and new markets, lack of capital and skilled labor. Their findings confirm that some organizations were on the low skill equilibrium with low skilled, low wage jobs. [8]
Cooke and Kulandaisamy (2010) tested Stephen Redding’s low-skill equilibrium trap hypothesis, by measuring wage growth in Idaho compared to the U.S. The hypothesis tested is that there is no difference in the average wage per job in the sectors of Idaho as compared to the U.S. between 2001 and 2009. Their results show that the U.S. average wage across sectors is significantly higher than in Idaho, suggesting that Idaho has a serious low wage problem. [6]
Sun (2021) investigates the impact of human capital indicators (highly educated workers number, management team education and age and general manager education and tenure) on innovation in China. This research used firm level survey conducted by the World Bank in 2002 and 2003. The findings show more important effect of human capital on innovation in mid-sized cities than in the metropolitan cities, where R&D is the most important factor. Moreover, general manager’s tenure has a negative impact on innovation in metropolitan cities, manager’s education has a positive effect on product proliferation, while age has a negative effect. Innovation, in this context, is defined as introduction of new products or entering a new business line. Sun (2021) considers R&D an important factor that determines the product innovation, thus, both human capital and R&D jointly impact product innovation in a company. Results suggest that “when years of schooling of management team increase one year, the probability of conducting product proliferation will increase 0.0473 and 0.033” [9].
Bye and Faehn (2022) analyze how human capital contributes to growth in Norway via the impact of innovation based on R&D. Human capital is defined as personnel with at least four years of university education with the purpose of understanding the channel through which human capital expands through the economy. In the human-capital-intensive R&D industry, 20% increase in human capital leads to 15.5% increase in the production of patents and a 5.3% increase of R&D-based capital. Another finding worth to be mentioned is that “with a sufficiently strong absorptive capacity channel, R&D activity is totally crowded out by productivity growth”, so “more human capital does not stimulate R&D activity; rather, production of patents falls by 24.7 percent, while R&D-based capital production falls by 14.7 percent. The results for this sensitivity illustrate that increasing the availability of human capital does not necessarily increase R&D activity” [10].
Cantabene and Grassi (2020) analyzed the impact of human capital (ratio of graduated R&D employees to total R&D employees) on R&D cooperation for firms in Italy. R&D cooperation is defined as a dummy variable if the firm has engaged in R&D partnership with universities or private agencies. The results show that human capital positively impacts the propensity of firms to cooperate in R&D projects: probability of cooperation increase 0.245% when there is increased human capital in the firm of 1% [11].
Chen et al. (2021) shows that the accumulation of human capital locally in the forms of university and engineering departments positively impacted innovation and R&D activities at 25 Asian cities from 2012-2016. Therefore, “the presence of a top university is found to be significantly associated with a higher propensity for firms to introduce product and process innovations as well as conduct R&D” [12, p. 17]. The probability of engaging in firm R&D increases 0.263% where a top university is present in the analyzed city.
Other result is that “the presence of a top arts and humanities major or natural sciences is associated with decreased propensity for firm innovation. As for having a top social sciences and management major, the estimates are positive for product innovation and negative for R&D. […] Universities with strong arts and humanities departments may not discourage firm innovation at all. Instead, it may be that they are located in cities with rich cultural or historical backgrounds that are not particularly attractive to entrepreneurs.” [12, p. 18].
Gallié and Legros (2012) studied the impact of firm employee training on innovation in France. Innovation production function – modeled as the number of patent applications during 1986-1992 – is modeled as depending on R&D expenditure and human capital (on the job training). The results show that employee training has a positive effect on innovation [13].
Other studies address the complementarities between human capital and R&D, such as Higón et al. (2017), finding inconclusive relationships for Spanish firms from 1993-2005. The hypothesis tested was that “the impact of R&D investments on firm productivity increases when the firm hires more qualified human capital” [14]. One possible explanation for the inconclusive complementarity between human capital and R&D is that “the performance of the innovation process depends on the appropriability conditions surrounding the firm” [15]. Thus, “even if R&D and human capital investments were complementary at the time of obtaining product and process innovations, these complementarities would not be reflected in the firm’s performance (i.e. productivity gains) unless the firm is able to appropriate the results of the innovation process” [14]. Kale (2021) found that in India “human capital has a positive and significant impact on innovation; statistically a 1% increase in human capital increases innovation by 1.07%” [16], while Ren and Song (2020) showed that human capital is positive related to R&D investments in China [17].
Sasso and Ritzen (2019) focused on “human capital measured by skills” and analyzed “its relationship with R&D investments and productivity across 12 OECD economies and 17 industries” [18]. Sasso and Ritzen (2019) found that there is no correlation between increase in school years and productivity, arguing that to improve cognitive skills of population as “investing in further schooling without ensuring commensurate improvements in cognitive skills does not lead to economic returns” [19]. Cognitive skills are argued to be a better approach to measure human capital.
MATERIALS, METHODS AND RESULTS
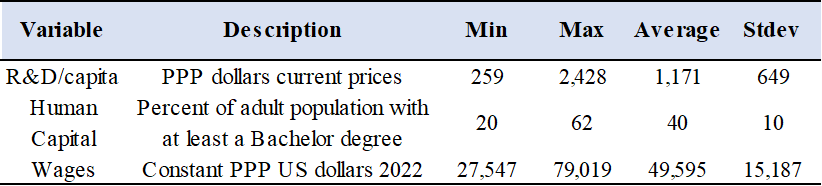
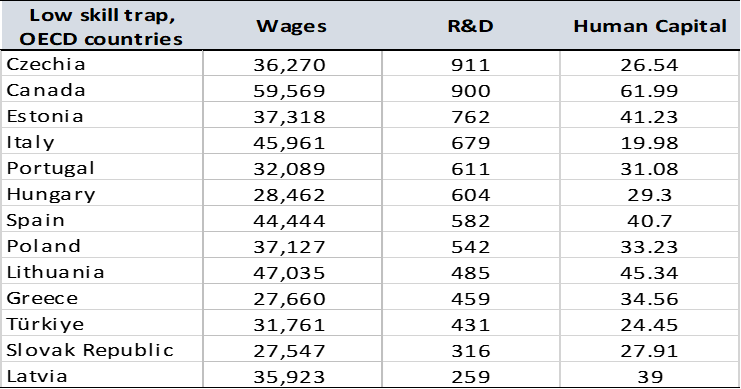
This study uses data for OECD countries for 2021 year. The variables and data sources used for this study are from OECD website, as follows: human capital – percent of adult population with at least a bachelor’s degree; wages – constant PPP US dollars 2022; R&D per capita – current PPP dollars, unemployment rate. The methodology used is descriptive statistics and regression analysis.
Source: Authors’ calculations based on OECD data
From Table 1, we can observe that, across OECD countries, the lowest R&D investment per capita is $259, the highest is $2,428 and the average is $1,171. The lowest human capital is 20%, the maximum is 62% and the average one is 40%. Regarding wages, the lowest wages are $27,547, the highest ones are $79,019, and average wages are $49,595. The wages are included in the analysis as a proxy for economic prosperity, which should be a characteristic of countries in the high skill trap.
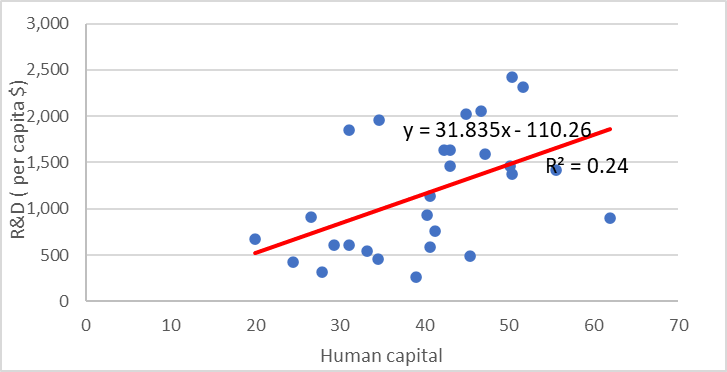
From Figure1, we can note that there is a moderate relationship between R&D and human capital (R-square = 0.24). This result suggests that a high human capital level in an OECD country does not guarantee high levels of R&D investment. However, the regression slope coefficient is significant at 1% level. This model indicates that countries with higher levels of human capital, under some conditions, may display higher levels of R&D per capita investment.
Source: Authors’ calculations
We analyzed a regression of wages on R&D and human capital. It has an adjusted R-square of 53% and statistically significant. The regression equation is:
The coefficient on R&D is statistically significant at 1% level, indicating that each $1,000 per capita investment in R&D is associated with $14,840 higher wages/year. Human capital coefficient is not statistically significant.
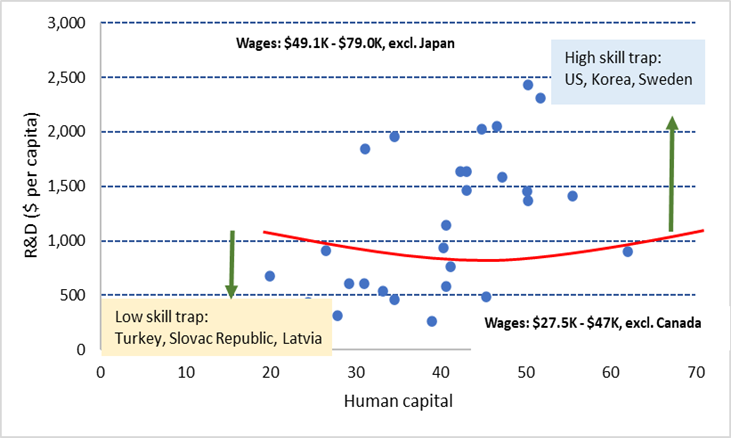
Using wages in the analysis will be helpful to define the high and low skill trap clusters across OECD countries. Wages level is used as a measure of economic prosperity, and it is used to define clusters of countries based on their R&D and human capital levels, and determine which countries belong to the high and low skill trap groups. The trap suggests that low levels of R&D are associated with low wages. In contrast, countries in the high skill trap, having high R&D and high human capital, should exhibit higher wages.
From data and visual inspection of Figure 2, a hyperplane was drawn to separate and create two clusters of high skill and low skill trap. A threshold of $920 per capita R&D expenditure was chosen to group countries in high/low skill equilibrium.
Source: Authors’ calculations
It is known that a measure of well being of a country is wages. It can be seen that countries in the low skill trap have lower wages, while in the high skill trap have higher wages. Excluding Canada, which is an outlier, low skill trap country wages range is between $27,547 and $47,035, average $35,966, while the wages in the high skill range between $50,467, and $78,894, $61,103 on average (Table 2).
Source: OECD, 2021
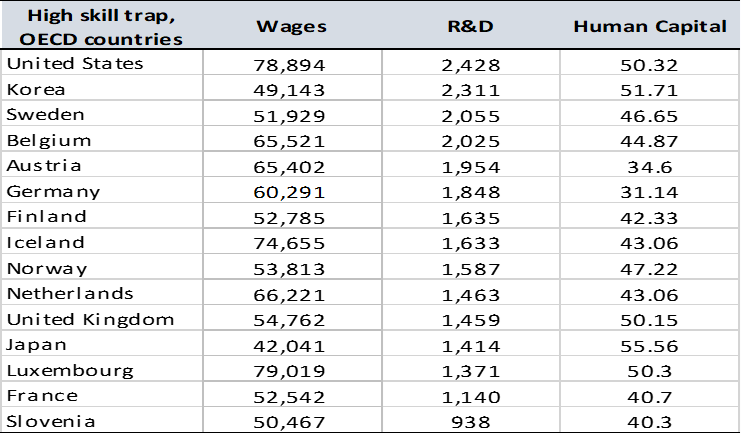
Table 2 shows countries that belong to the high and low skill trap respectively. Amongst the top countries in the high skill trap are United States, Korea, and Sweden. Amongst the bottom three countries in the low skill trap are Latvia, Slovak Republic, and Turkey.
One particular case to investigate is Japan ($1,414 R&D; 55.6% human capital). Japan has high R&D and high human capital; however, Japan’s wages are $42,041, a lower level than the level of countries that belong to the high skill trap group (with wages range between $49,143-$79,019, and an average of $61,103). This suggests that Japan may be experiencing challenges, that could be given by aging population, low aggregate demand, and deflation.
Another interesting case is Canada ($900 R&D; 62% human capital), which would be categorized in the low skill trap, based on the cluster groups driven by R&D threshold level below $920, since Canada R&D is $900. However, Canada wages are $59,569 comparable to average of countries in high skill trap. So, Canada’s wage level does not belong to the one exhibit in the low skill trap group, where human capital ranges from 20%-45% (33% average). It could be argued that Canada’s high wages may be driven by other factors, such as its richness in natural resources and land and high levels of immigration, that help to increase GDP and aggregate demand, in comparison with other countries positioned in the low skill trap.
DISCUSSION
The regression analysis in this paper found wages highly correlated with R&D per capita, with human capital not being significant. However, using cluster analysis, we found that countries in the high skill trap have a level of human capital with at least bachelor attainment over 40%. These results suggest that one prerequisite for a country to have high R&D is to have high education attainment or human capital and that the combination of high levels of human capital and R&D have the potential to produce high wages, a proxy for economic prosperity. These findings suggest that, in order to have strategic complementarities between human capital and R&D in a country, certain conditions must be met.
Canada and Japan are particularly interesting. Both countries have an aging population. In 2022, Japan population over 65 years old was almost 30% [20], compared to 20% in Canada [21]. In addition, Japan’s foreign population was 2.6% [20], compared to 23% in Canada [21].
On one hand, Japan has an economic and demographic structure that makes it difficult to raise wages. Low prices, a strong yen, pushed the cost of imports down, without much change in consumer price inflation. Another reason may be due to low productivity in Japan, that is a function of factors of production like land, labor, and capital, together with aging population, that is associated to lower labor productivity, and thus lower wages. Furthermore, in 2022, 21.3% of Japan’s labor force worked part time [22]. So, labor hoarding is another reason for low wages in Japan. When a crisis hit, employers do not dismiss their workers, but they keep them employed for life. People are paid in Japan based on seniority rather than performance, lowering the incentives for changing jobs, that has been associated with higher wages. Out of those 28 countries, the Slovak Republic had the lowest wages ($27,547), while Luxembourg registered the maximum ones ($79,019). (Figure 3)
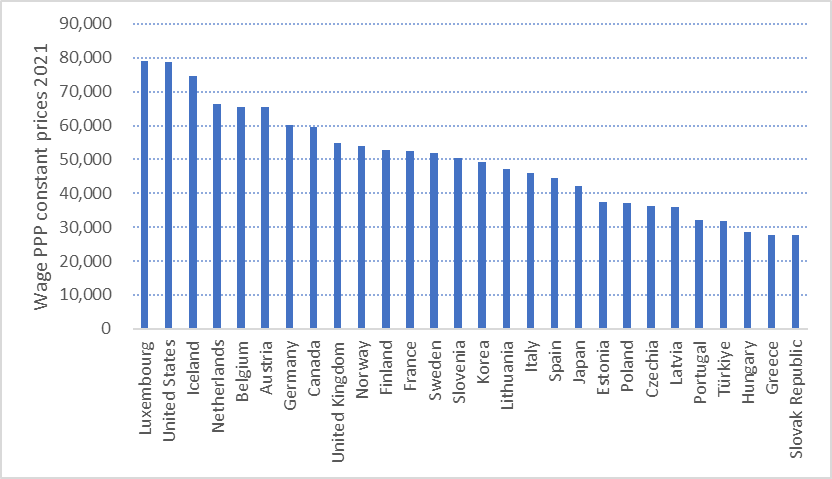
Source: OECD, 2021
On the other hand, in what regards Canada, a country rich in natural resources, the perceive natural resources rents count 4.95% of GDP, compared to only 0.0473% for Japan [23]. Thus, working force characteristics and natural resources may explain in part higher wages in Canada in comparison with Japan, even though R&D levels in Canada are low compared to countries in the high skill trap.
We should note that, even though Canada has the highest level of human capital (over 60%) among OECD countries, a high proportion of foreign residents, who are highly educated, may face barriers of cultural integration in Canada. Upon entry, immigrants in Canada face a wage disadvantage as compared to native born, their wages being 30% below the corresponding native born. However, it is well known that immigrants work harder than Canadian born, and after some years, their wages are higher than native born Canadians. We can see from Figure 4 that, in the year 2021, Italy had the minimum level of human capital (20%), while Canada registered the maximum one (62%). Above 50% in the level of human capital were included Japan (55%), Korea (51%), Luxembourg (50%), UK (50%) and United States (50%).
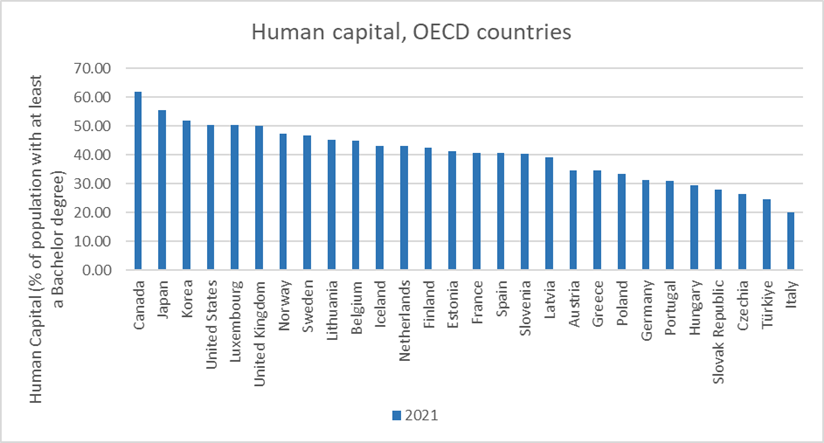
Source: OECD, 2021
Accordingly, there are many reasons why Canada has low R&D. First, the ratio of large to small and medium enterprises is very low in Canada; there are over three times as many large businesses in U.S. than Canada [24]. Moreover, Canada has challenges in converting new R&D into products and services that can be commercialized. Institutions need to be transformed, but Canada lags behind industrial policies that would accelerate its economic growth. In the United States of America, the adoption of the Inflation Reduction Act and the CHIPS and Science Act is quite consequential: It is also mentioned that “the world’s largest economy (and Canada’s largest trading partner) has a clear strategic industrial policy for the first time since the Cold War” [24]. Canada has 57% share of R&D funds by business enterprise going into services sector, while Japan has only 8%. In Japan, the majority of R&D funds performed by businesses go into manufacturing (90% share), while Canada manufacturing share is only 32%. Rest of the world invested in Canada R&D in the year 2019 as much as 17% share, while in Japan this is insignificant, as 0.64% share. 5.62% of R&D source of funds in Canada comes from the government sector, while in Japan this share is 0.85%. Services in Japan have 8.3% share. (Table 3)
Source: OECD R&D data, year 2021
Furthermore, if R&D investments are not translated into new products and new technologies, it limits the country’s potential to grow. Finally, a country may develop technologically advanced products but may face trade tariffs, such is the case for China with 100% tariffs upon entry in the U.S. market for some products. Geopolitics may limit the potential of growth in wages and economic growth in some countries.
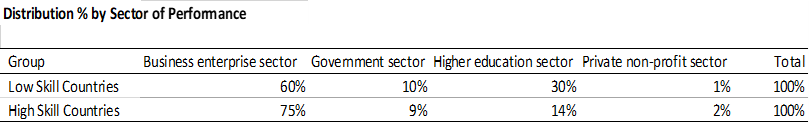
The data suggests that governments in low skill trap countries compensate the low level of funding from the business sector in R&D by providing the funding to the higher education sector. This can be observed given the fact that the government funded 33% of total R&D, as compared to only 21% of the total R&D in the high skill group. In the low skill countries, 10% of the total R&D is invested in the government sector, similar to 9% in high skill countries. So, the remaining part of government funds in R&D in low skill countries are invested in the higher education sector, which have 30% of the total investment in R&D. Note that only 6% of total R&D was funded by the higher education sector in low skill countries. This effort from the government may be intended to compensate the fact that business enterprises in low skill countries invest only 50% of the total R&D, as compared to 68% in the high skill countries.
High skill countries have 89% of the share of total OECD R&D investment, while low skill countries only the remaining 11%. This is driven by the fact that high skill countries represent 71% of the total OECD population and have a GDP per capita 45% higher than low skill trap countries. These two facts result in high skill countries accounting for 78% of GDP share of the total OECD countries’ GDP. Additionally, high skill countries invest 3.29% of GDP in R&D, versus only 1.47% in low skill countries, based on the year 2021 current US$ dollar calculations.
Source: OECD, 2021
CONCLUSION
This paper suggests, on one hand, the minimum level of human capital that make the conditions favorable for R&D and would classify the country in the high skill. Therefore, education attainment must be above 40% of adult population with at least a bachelor’s degree. On the other hand, the first condition for high wages is that a country should have high human capital. However, high human capital does not guarantee that a country has high R&D and high wages. Austria and Germany have relative low human capital as 34.6% and 31.14% respectively, but high R&D as $1,954 and $1,848 respectively (Figure 5). This suggests that a country does not necessarily need to have high human capital but enough human capital to attract high levels of R&D (over $1,000 per capita) and the opportunity to produce a spillover effect.
According to the theory of skill trap, an economy in the low skill equilibrium is characterized by low employment opportunities and low wages. Low skill countries have low wages, in the range of minimum $27,547 in Slovak Republic to $47,035 in Lithuania. Countries in the high skill equilibrium have relative high wages, with minimum of $49,143 in Korea and maximum of $79,019 in Luxembourg. Low employment opportunities coexist with low levels of R&D. Countries with unemployment above 6% are characterized by very low R&D levels except for Finland (unemployment 7.6%, R&D $1,635 per capita) and Sweeden (unemployment 9%, R&D $2,000). The opposite is also observed. So, low unemployment levels coexist with high levels of R&D (exceptions are Hungary, Poland, Canada, and Estonia).
In conclusion, a consequence of R&D investment is technology spillovers, with private and social return to R&D. R&D spillover matters for the economy as the innovation is a critical success factor that drives the economic growth and productivity. For instance, the social return to aerospace R&D is more than four times as large as the private return. Therefore, this paper finds evidence of Stephen Redding’s skill equilibrium hypothesis at the country level. U.S., Sweden and Korea are in the top 90th percentile of R&D and human capital, exhibiting R&D higher than $2,034 per capita and human capital higher than 50.7%. Turkey, Slovakia and Latvia are in the bottom 10th percentiles exhibiting below $450 R&D per capita and 27.4% human capital.
We conclude that, empirically, the theory is supported by the OECD data and all OECD countries can be grouped belonging in either the high or low skill trap.